Dashboards
Last updated: November 7, 2025
Report on specific metrics with Rally Dashboards to gain insight into your Studies and Participant activities over time.
Create your own Dashboards, add specific reports, and reorder and edit to customize your view. Within each dashboard, select the timeframe for the data shown across all reports. You can edit each report to customize groupings, filters, and breakdowns and display specific properties or attributes.
See the complete list of available reports below.
Person Reports
Person Reports relate to activity with Participants for Studies:
Completed Surveys Over Time
Completed Screeners Over Time
Completed Unmoderated Tests Over Time
Interview Invites Over Time
Interview No Shows Over Time
Completed Interviews Over Time
Canceled Interviews Over Time
Scheduled Interviews Over Time
Opt Outs Over Time
Avg Time To Recruit
Time to Recruit (per participant) is the duration between Study Invite Sent Time and Study Completed Time (Survey, Interview, or Unmoderated Test completed).
Note: Participants recruited to Studies via public share links (rather than unique email invitations through Rally) cannot be tracked with this metric.
Study Reports
Study Reports relate to (surprise!) Studies and can be broken down by Study type or time (i.e. monthly):
Studies Published Over Time Test
Studies Closed Over Time
Note: Data for Study Reports is only available from May 2024 and after.
View All Dashboards
View all dashboards for your organization's workspace by navigating to 'Dashboards' from the top navigation bar in Rally. See each dashboard name, # of reports included, and which teammate created it.
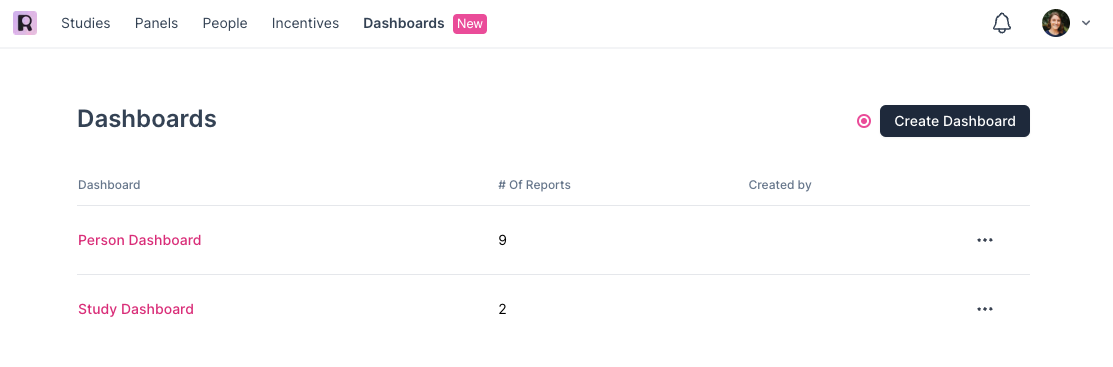
Select a dashboard name to open. You can view, edit, duplicate, filter, delete, or reorder the reports inside - keep reading below to learn more!
While viewing a report broken down by a specific attribute, click any option in the legend (colored block representing an attribute) to hide that data, or double click any option to hide all other data.
Select the 3 dots ... to the right of any dashboard to take the following actions:
Rename
Duplicate
Delete
Create a Dashboard
Create a dashboard with a custom name, add up to 10 reports, reorder them, and edit them to view specific data points. Within each dashboard, select the dropdown in the top left to change the timeframe for the data shown.
Select 'Dashboards' from the top navigation bar in Rally.
From the dashboards overview, select 'Create Dashboard' in the top right.
In the popup, enter a name for the new dashboard and select 'Create Dashboard'.
The new dashboard is created without reports; select '+ Add Reports' to get started.
Skip to step 3 in the next section. ↓
Add Reports
Add reports to a dashboard.
Navigate to 'Dashboards' from the top nav bar and select a dashboard to open.
Select '+ Add Reports' in the top right.
In the popup, select the checkboxes next to each report to add.
Select 'Add Reports' to confirm and add all reports from the selected set.
Delete Reports
Delete reports from a dashboard.
Navigate to 'Dashboards' from the top nav bar and select a dashboard to open.
Select the 3 dots ... in the top right corner of any report.
Select 'Delete' to immediately remove the report from the dashboard.
Reorder Reports
Reorder reports within a dashboard.
Navigate to 'Dashboards' from the top nav bar and select a dashboard to open.
Select 'Reorder Reports' in the top right.
Use the up and down arrows to the right of each report to change their display order.
Select 'Apply Changes' to save the new order, or select 'Cancel' to abandon edits.
Edit Reports
Within each dashboard, you can edit each report to change the selected timeframe, configure how data is grouped or broken down, and add filters to display specific properties or attributes.
Navigate to 'Dashboards' from the top nav bar and select a dashboard to open.
Select the 3 dots ... in the top right corner of any report.
Select 'Edit Report' to customize.
In the popup, select from each dropdown to test different views.
Timeframe determines the date range: All Data, Last 30 Days, Last 90 Days, Last 365 Days, This Month, This Quarter, This Year.
Group data by determines how granular the data will be: Day, Week, Month.
The x-axis (horizontal) will update to reflect your selection.
Breakdown by defaults to "Nothing selected" to combine all data for the set ranges together regardless of type/attribute, or you can separate it to easily view the different counts for each. See the key below the report graph noting which colors represent each attribute, and hover over a bar on the report to see the attribute and count. Select an option from the dropdown:
Study Reports options include: Nothing selected (combine all) or Type (separate by Study type such as Survey, Interviews, Unmoderated Tests).
Person Reports options may vary by workspace: select from the different Properties within your workspace and more.
Refine reports even further to hone in on specific data by adding filters to any report.
While editing a report, select '+ Add Filter' or '+ Add Filter Group' and then select the property/attribute, operator, and value desired for each filter added. Select the 3 dots ... to the right of a filter or filter group to 'Remove' or 'Duplicate' it.
You can also edit the report's name at this time to describe the data shown.
Select 'Save' to apply changes or select 'Discard Changes' to abandon.
Duplicate Reports
Duplicate reports from a dashboard, including any configuration edits or filters added. Quickly build out a dashboard using different filters and configurations of the same core report to highlight different values, properties, etc.
Navigate to 'Dashboards' from the top nav bar and select a dashboard to open.
Select the 3 dots ... in the top right corner of any report.
Select 'Duplicate'.
Edit the new report as needed.
Delete a Dashboard
Navigate to 'Dashboards' from the top nav bar.
Select the 3 dots ... to the right of any dashboard and select 'Delete'.
In the confirmation popup, select 'Delete' to immediately remove the report from the dashboard.
Note: Deleting a dashboard removes it for the entire workspace. Use caution when deleting dashboards others have created or that may be used by other teammates.
Share Dashboard
Share any dashboard with Rally teammates by navigating to the dashboard, copying the URL from your browser, and sharing it directly however you like. Dashboards and reports are only visible to logged in Rally users.
Timezones
All date & time values in dashboards display the workspace timezone, not the specific timezone of the user viewing the report. This is done intentionally to ensure that users viewing the same dashboard from different timezones will always see the same data.
Limits
Dashboards currently allow up to 20 dashboards per workspace, with up to 10 reports per dashboard.
Report Data Refresh Rate
Data shown in reports may be delayed by up to an hour. Please allow this time for any recently logged changes or activity in Rally to update and reflect in reports.